Table contents
Introduction
- 1.1. Overview of the Aviation Sector
- 1.2. AirAustralsia’s Challenges
Problem Identification
- 2.1. Benchmarking
- 2.2. Environmental Audits (PEST Analysis
Critical Discussion
- 3.1. McKinsey 9 Box Matrix: Benefits & Limitations
Application of Theory
- 4.1. Route Portfolio Analysis: Kuala Lumpur to Jakarta / Bangkok to Manila / Kuala Lumpur to Ho Chi Minh City / Jakarta to Bali
Recommendations and Conclusion
- 5.1. Strategic Recommendations
- 5.2. Conclusion
References
Introduction
In recent years, the aviation sector in Southeast Asia has seen a significant increase in activity due to a robust recovery of international tourism in the post-pandemic era. This notable increase in travel demand, particularly to popular leisure destinations such as Thailand, Vietnam, and Indonesia, has been instrumental in propelling the growth of regional airlines (TTW, 2025).
While a potential increase in tourism presents growth opportunities, it also presents challenges. Airlines seeking to capitalize from this demand (IATA, 2025), navigate a dynamic industry landscape, and consolidate their presence within the market, must utilize various consultancy management methodologies and strategies to analyse their current business environment and assess their strengths, weaknesses, opportunities, and threats Two methodologies that can be employed to achieve these objectives would be to employ benchmarking and McKinsey 9 Box Matrix (Quarterly, 2008).
AirAustralsia, a new low-cost carrier (LCC) airline start-up in Southeast Asia that was founded in 2023, faces considerable challenges of achieving sustained growth and profitability in a competitive market. The aim of this assessment is to apply the McKinsey 9 Box Matrix to analyse AirAustralsia’s current route portfolio, focusing on the four routes mentioned in the case study: Kuala Lumpur to Jakarta, Bangkok to Manila, Kuala Lumpur to Ho Chi Minh City, and Jakarta to Bali. The aim is to classify these routes based on industry attractiveness and AirAustralsia’s competitive strength and subsequently provide strategic recommendations for future investments, fleet allocation, and service offerings.
Problem Identification
Considering that numerous airlines have faced collapse at various points, a critical question arises: “Is there a viable market for long-haul low-cost carriers?” For ambitious start-ups, it is pertinent to re-examine the market dynamics to identify critical insights that may determine a carrier’s probability of success (Grant, 2025). Despite ambitious growth plans, AirAstralasia has several significant hurdles that necessitate strategic evaluation and decision-making. Several of the following management consultant methodologies and frameworks [such as benchmarking and environmental audits] can be used to analyze the strategic challenges faced by airline:
Benchmarking, as defined by Francis et al., (1999), is the pursuit by organisations of enhanced performance by learning from the successful practices of others. The process of assessing business performance by comparing its performance to that of its competitors allows airlines to benchmark their routes against other carriers (low-cost or full-service) to identify areas of success, areas for improvement, or reason for lower success. Conducting benchmarking would allow AirAstralasia to identify and improve its operational efficiency, reduce costs, enhance customer experience, and maintain a competitive edge in some of the following ways:
1. Operation efficiency: By comparing fuel efficiency against industry leaders, AirAstralasia can identify cost-saving strategies such as optimising flight routes, using newer aircraft, and implementing fuel management systems.
2. Marketing & Brand Positioning:ByEvaluating the social media engagement strategies of leading LCCs, AirStralasia can compare their own customer acquisition and retention strategies, such as promotions, partnerships, and loyalty programs, to identify best practices.
3. Sustainability Benchmarking: By analyzing the carbon reduction initiatives of other airlines, such as sustainable aviation fuel (SAF) adoption and carbon offset programs, AirAstralasia can identify industry best practices, align with waste reduction and fuel efficiency initiatives, and decide how best to utilise their new fuel-efficient Airbus A321neo aircrafts.
4. Router Performance: Like operation efficiency, AirAstralasia could benchmark both its high-performing routes and underperforming routes against routes of other LLCs. This can help identify best practices and highlight opportunities to improve.
Additionally, environmental audits are critical for problem identification as it provides a comprehensive understanding of how external and internal environmental factors influence organizational performance. One strategic tool is the PEST (Political, Economic, Social, and Technological) framework. It helps organizations identify opportunities and threats by examining how external factors, even minor economic changes, can significantly impact business performance (Carruthers, 2009). Environmental audits can be employed to strengthen organisational capabilities and address weaknesses by identifying some of the following problems:
1. Political Factors (P): Examines the impact of government policies, such as taxation, regulatory frameworks, and political stability. For instance, a reduction of taxation would inject more business liquidity, whereas political instability along carrier routes could explain a reduced profitability or signal operational safely.
2. Economic Factors (E): Economic conditions consider both short-term and long-term economic trends, such as inflation, exchange rates, GDP growth, unemployment, and fiscal policies, directly affect industries. Additionally, this may also include seasonal weather trends.
3. Social Factors (S): Socio-cultural elements, including demographics, cultural values, and consumer attitudes, contribute to shaping market dynamics. For instance, a rising middle-class could increase a demand for luxury travel, while cultural preferences influence product acceptance.
4. Technological Factors (T): Technological advancements drive industry evolution, reducing production costs and enhancing customer satisfaction. Technological progress can expand existing markets and create new opportunities. For example, technological advancement leading to efficient resource utilization. These technological cost savings can then be passed on to consumers, strengthening market position (Journals et al., 2015, p. 25).
According to Vukotic et al., (2017) consulting can be defined as a professional support of the company’s managers in analysing and solving practical problems. It facilitates the transfer of successful management system from one company to another or from one organization to another. In the context of AirAstralasia, benchmarks and environmental audits can highlight areas requiring performance improvements, those facing environmental risks, or instances of non-compliance. These identified problems related to competitiveness and environmental impact demonstrate the need for consultancy advice. Consultants with expertise in strategic management, finance, marketing, operations management, sustainability strategies, or environmental regulations (Kostiuk & Chikalkin, 2024) can uncover key factors influencing the competitive positioning of AirAstralasia as it aims to capitalize on the growing demand for affordable air travel in the Asia-Pacific region.
Critical Discussion
In the airline industry strategic decisions are made frequently that involve adjustments to route systems and the reallocation of resources across routes. These resource allocation decisions are guided by the evaluation of key factors, including competitive strength and market attractiveness, which serve as foundational criteria for determining optimal distribution of resources (Mokaya et al., 2012). This critical discussion aims to evaluate the McKinsey 9 Box Matrix is terms of its relevancy, benefits, whilst highlighting some of its limitations as an evaluation tool.
The McKinsey 9 Box Matrix is a framework used to assess the performance and growth potential of business units or product portfolios within an organization. Structured as a 3×3 grid, the matrix evaluates industry attractiveness on the vertical axis and competitive strength on the horizontal axis (see Figure 1). Three categories are used to identify both attractiveness and strength, to grow, to hold or to harvest. This involves making adjustments in each controllable factor to result in a desirable position (Mankhin et al., 2023).
One of the benefits of mapping out the attractiveness and strengths across a grid is that it allows for organizations to pinpoint strategic opportunities and risks by considering a combination of internal capabilities and external market conditions. This analytical framework is relevant for industries with dynamic competitive landscapes, such as the low-cost carrier (LCC) airline sector. In this context, airlines can utilise the matrix to evaluate factors such as market size, growth rate, profitability, competitive intensity, and demand variability (Bruin, 2021). Additionally, the competitive strength dimension evaluates a business unit’s performance relative to its competitors. This may include market share, brand positioning, customer loyalty, and product differentiation (Mokaya et al., 2012). This internal analysis helps firms assess their strengths and weaknesses, identifying areas for strategic enhancement.
The positioning of business units within the matrix serves as an analytical framework to guide management decisions. Units situated above the diagonal are generally considered suitable for investment and growth-oriented strategies. However, those placed diagonally may require targeted or selective investment, whereas units located below the diagonal are frequently regarded as less favoured for additional investment, often making them potential candidates for divestment or liquidation. (Dias et al., 2017).
By employing the matrix, low-cost carriers can identify their market positioning relative to their competitors and determine the most advantageous paths for growth or restructuring, ultimately enhancing their operational effectiveness. For instance, Mokaya et al., (2012) conducted a study to assess the application of McKinsey Matrix in the determination of route attractiveness and resource allocation in Kenya Airways as basis for resource allocation. 14 factors were used on the Matrix, such as market growth, market size, barriers to entry, competitive rivalry, market concentration, market segmentation, product differentiation, and others. Data was gathered from 100 managers and supervisors concluded that the McKinsey Matrix is a viable tool for application within the airline industry, as the findings demonstrated that 96.1% of changes in resource allocation can be attributed to market attractiveness and business strength.
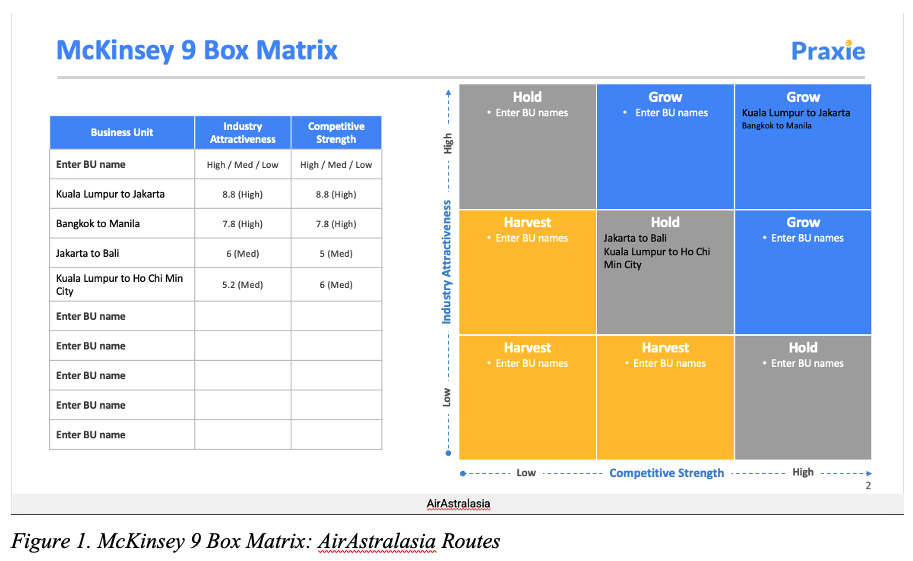
Figure 1. McKinsey 9 Box Matrix: AirAstralasia Routes
While the matrix offers airlines a tool to comprehensively evaluate their operational performance, it is not without limitations. An identified limitations pertains to the separation of internal and external factors. In that, the matrix evaluates industry attractiveness (external factors) and business strength (internal factors) separately. The matrix has faced criticism for its complexity, particularly in identifying and assessing the key internal and external factors necessary for its framework. As Lin & Hsieh (2004) highlight, industry attractiveness is measured using external, often uncontrollable factors, while business strength is evaluated based on internal factors that are typically within the organization’s control. This reliance can make the analysis less actionable, as organizations cannot directly influence these variables.
Overall, the McKinsey 9 Box Matrix serves as a valuable strategic tool for evaluating industry attractiveness and competitive strength, particularly within the low-cost carrier airline industry. The framework enables organisations to identify growth opportunities, allocate resources effectively, and address areas of weakness, as demonstrated in the study by Mokaya et al. (2012). However, the limitations of the matrix, particularly its complexity in assessing and integrating internal and external factors, as well as its reliance on uncontrollable external variables, would require pairing with another evaluation tool to generate a complete picture of the airline industry language.
Application of Theory
Applying the McKinsey’s 9 Box Matrix to low-cost carriers (LCCs) provides a systematic approach to evaluate their market attractiveness and competitive strengths within the airline industry. The analysis of AirAustralsia’s route portfolio is conducted using the McKinsey 9 Box Matrix which provides a structured framework for evaluating the airline’s current position and identifying strategic opportunities for growth and profitability. Each route is assessed based on two key dimensions: industry attractiveness and competitive strength. Industry attractiveness considers factors such as market growth, profitability, and barriers to entry, while competitive strength evaluates AirAustralsia’s relative position in terms of market share, brand recognition, and operational efficiency using the data outlined in the case study notes.
The following is scoring methodology used each route to evaluate the market attractiveness and competitive strength based on the predefined factors (see Table 1). Each factor was assigned a score from 1 to 10, where: 1 = Low (e.g., low demand, weak competitive position); 10 = High (e.g., high demand, strong competitive position).
| Overall Score = | Sum of Individual Factor Scores |
| Number of Factors |
Below is a detailed analysis of the four key routes, supported by hypothetical data and industry benchmarks.
| Airline Route | Kuala Lumpur to Jakarta | Bangkok to Manila | Kuala Lumpur to Ho Chi Minh City | Jakarta to Bali |
| Market Attractiveness | ||||
| Demand Growth | 9 | 8 | 6 | 5 |
| Profit Margin | 9 | 8 | 5 | 5 |
| Competition | 9 | 7 | 7 | 6 |
| Regulatory Environment | 8 | 8 | 5 | 5 |
| Economic Stability | 9 | 8 | 5 | 5 |
| Sum of Scores | 44 | 39 | 30 | 26 |
| Averages (44/5) | 8.8 (9) | 7.8 (8) | 6 | 5.2 (5) |
| Competitive Strength | ||||
| Market Share | 9 | 8 | 5 | 6 |
| Operation Efficiency | 9 | 8 | 5 | 6 |
| Brand Positioning | 8 | 7 | 5 | 6 |
| Frequency of Flights | 9 | 8 | 5 | 6 |
| Fleet Suitability | 9 | 8 | 5 | 6 |
| Sum of Scores | 44 | 39 | 25 | 30 |
| Average (44/5) | 8.8 (9) | 7.8 (8) | 5 | 6 |
Table 1: AirAstralasia’s route portfolio analysis
1. Kuala Lumpur to Jakarta:
- Industry Attractiveness: This route is described as a high-performing route with strong customer demand and limited competition. The Southeast Asian aviation market is experiencing robust growth, with an annual growth rate of approximately 8% (Gosavi, 2024) and profit margins averaging 15% for low-cost carriers (Researchnester, 2025). Given these metrics, the Kuala Lumpur to Jakarta route scores highly on industry attractiveness. The route benefits from high passenger volumes, driven by business and leisure travel between two major economic hubs.
- Competitive Strength: AirAustralsia holds a strong competitive position on this route, likely due to effective pricing strategies, optimal flight scheduling, and early market entry. However, the presence of competitors such as AirAsia, which commands a competitive market share on similar routes, poses a potential threat. Additionally, full-service carriers like Singapore Airlines have introduced budget-friendly pricing on this route, which could encroach on AirAustralsia’s market share if not addressed proactively.
- Risk Assessment: Potential risks include fluctuating fuel prices, which could increase operational costs, and regulatory changes related to carbon emissions, which might require the airline to upgrade its fleet. These factors could impact the route’s profitability and attractiveness in the long term.
- Placement: Based on the analysis, this route falls into the “High Attractiveness – Strong Strength” quadrant of the McKinsey 9 Box Matrix, indicating a strong case for continued investment and strategic focus.
2. Bangkok to Manila:
- Industry Attractiveness: Like the Kuala Lumpur to Jakarta route, Bangkok to Manila is identified as a high-performing route with a strong customer demand and limited competition. This route benefits from high passenger volumes, most likely driven by tourism and business travel between two major Southeast Asian cities. Assuming a market growth rate of 7% and a profit margin of 14%, this route also scores highly on industry attractiveness.
- Competitive Strength: AirAustralsia’s competitive position on this route is strong, supported by its low-cost model and frequent flight offerings. However, competition from regional low-cost carriers like Cebu Pacific and full-service airlines such as Thai Airways could pose challenges (OAG, 2024). AirAustralsia’s ability to maintain its competitive edge will depend on its capacity to optimize costs and enhance customer satisfaction.
- Risk Assessment: Key risks include economic downturns, which could reduce passenger demand, and geopolitical tensions, which might disrupt flight operations. Additionally, rising operational costs due to airport fees and fuel price volatility could impact profitability.
- Placement: This route is also positioned in the “High Attractiveness – Strong Strength” quadrant, making it a priority for investment and growth.
3. Kuala Lumpur to Ho Chi Minh City:
- Industry Attractiveness: This route is identified as underperforming, with customer numbers stagnating due to strong competition and fluctuating tourism demand. The market growth rate for this route is estimated at 4%, with a profit margin of 8%, indicating lower industry attractiveness compared to the high-performing routes. The route faces challenges such as overcapacity and intense price competition from both low-cost and full-service carriers.
- Competitive Strength: AirAustralsia’s competitive position on this route is weak, as evidenced by stagnant customer numbers and strong competition from airlines like Vietnam Airlines and AirAsia. The airline’s low-cost model has not been sufficient to differentiate itself in this highly competitive market.
- Risk Assessment: Risks include declining tourism demand due to economic instability and increasing operational costs. Additionally, the recent regulatory changes within Vietnam’s aviation sector could present complications to future operations (Federation of Airworthiness, 2025).
- Placement: This route falls into the “Low to Medium Attractiveness – Medium Strength” quadrant, suggesting there needs to be careful evaluation and potential divestment if profitability cannot be improved.
4. Jakarta to Bali:
- Industry Attractiveness: Similar to the Kuala Lumpur to Ho Chi Minh City route, Jakarta to Bali is underperforming, with customer numbers stagnating due to strong competition and fluctuating tourism demand. The market growth rate is estimated at 5%, with a profit margin of 9%, indicating lower industry attractiveness. The route is heavily reliant on tourism, making it vulnerable to external shocks such as economic downturns or natural disasters.
- Competitive Strength: AirAustralsia’s competitive position on this route is weak, as it faces intense competition from both low-cost carriers like Lion Air and full-service airlines such as Garuda Indonesia (OAG, 2024). The airline’s low-cost model has not been sufficient to capture a significant market share.
- Risk Assessment: Key risks include overcapacity, price wars, and external factors such as natural disasters or pandemics, which could severely impact tourism demand. Additionally, the rising operational costs and regulatory changes in Indonesia’s aviation sector could continue to cause profitability challenges (Amin, 2025).
- Placement: This route is also positioned in the “Low to Medium Attractiveness – Medium Strength” quadrant, indicating a need for selective investment or potential divestment.
Recommendations and Conclusion
Based on the analysis, the following strategic recommendations can be made to the various routes. The routes analysed as High Attractiveness – Strong Strength (Kuala Lumpur to Jakarta, Bangkok to Manila)represent the most attractive opportunities for investment and should be the top priority. It is therefore recommended that AirAustralasia allocate the new Airbus A321neo aircraft to these routes to capitalize on their fuel efficiency and suitability for medium-haul flights. Also, investments should be made in marketing and promotional activities to strengthen brand loyalty and attract new customers. Additionally, the airline can explore the introduction of a premium service for business travellers, while this implementation would require extra training for staff members to meet higher service standards, the estimated ROI of 2.3 times higher than its cost of production (Hugon-Duprat & O’Connell, 2015).
For the routes identified as Low to Medium Attractiveness – Medium Strength (Kuala Lumpur to Ho Chi Minh City, Jakarta to Bali) a careful evaluation and selective investment is required. The airline can choose to implement a “harvest” strategy, focusing on cost reduction and operational efficiencies to maximize cash flow. This can be achieved by reallocate older, less efficient aircraft to these routes to minimize costs. Also, exploring strategic partnerships with local tourism boards to boost passenger numbers. However, if these routes continue to draw a loss of profitability, the next step should be to consider exiting these routes and reallocating resources to more attractive opportunities.
To conclude, the application of the McKinsey 9 Box Matrix to AirAustralsia’s route portfolio provides valuable insights for strategic decision-making. The analysis highlights the need for strategic investment in high-performing routes, selective investment or potential divestment to underperforming routes, and taking careful consideration of fleet allocation and service offerings. By aligning these strategic decisions with the insights gathered from this analysis, AirAustralsia can enhance its potential for sustained growth and profitability in the competitive Southeast Asian aviation market. That said, it is important to note that this analysis is based on limited information, and further in-depth market research would be necessary to validate these findings and provide details recommendations
References
- Amin, I. (2025) Airline industry still struggling to grow. PwC. Available at: https://www.pwc.com/id/en/media-centre/infrastructure-news/february-2025/airline-industry-still-struggling-to-grow.html (Accessed: 23 March 2025).
- Bruin, L. de (2021) GE McKinsey Matrix explained with examples: B2U. Business-to-you. Available at: https://www.business-to-you.com/ge-mckinsey-matrix/ (Accessed: 20 March 2025).
- Carruthers, H. (2009) ‘Using PEST analysis to improve business performance’, In Practice, 31(1), pp. 37–39. Available at: https://doi.org/10.1136/inpract.31.1.37 (Accessed: 19 March 2025).
- Dias, J., et al. (2017) ‘Introducing the next-generation operating model’. McKinsey. Available at: [insert URL if applicable] (Accessed: 19 March 2025).
- Federation of Airworthiness, I. (2025) Vietnam considers regulatory changes to allow Comac aircraft operations. VietNamNet News. Available at: https://vietnamnet.vn/en/vietnam-considers-regulatory-changes-to-allow-comac-aircraft-operations-2380363.html (Accessed: 22 March 2025).
- Francis, G., Hinton, M., Holloway, J. and Humphreys, I. (1999) ‘Best practice benchmarking: a route to competitiveness?’, Journal of Air Transport Management, 5(2), pp. 105–112. Available at: https://doi.org/10.1016/S0969-6997(99)00005-8 (Accessed: 20 March 2025
- Grant, J. (2025) What makes a long-haul low-cost airline succeed or fail? OAG. Available at: https://www.oag.com/blog/what-makes-a-long-haul-low-cost-airline-succeed-or-fail (Accessed: 20 March 2025).
- Gosavi, S. (2024) Asia Pacific low cost airline market USD 69354.80 million in 2024 and will grow at a compound annual growth rate (CAGR) of 8.0% from 2024 to 2031. Cognitive Market Research. Available at: https://www.cognitivemarketresearch.com/regional-analysis/asia-pacific-low-cost-airline-market-report?srsltid=AfmBOopZVjR_UUbUNP_MxDEZyP4u4lPP7ThGI1grhs7lRq-UFe93elpg (Accessed: 22 March 2025).
- Hugon-Duprat, C. and O’Connell, J.F. (2015) ‘The rationale for implementing a premium economy class in the long haul markets – Evidence from the transatlantic market’, Journal of Air Transport Management, 47, pp. 11–19. Available at: https://doi.org/10.1016/j.jairtraman.2015.03.005 (Accessed: 22 March 2025)
- IATA (2025) Asia-Pacific’s air travel market: Opportunities and challenges. IATA. Available at: https://www.iata.org/en/publications/newsletters/iata-knowledge-hub/asia-pacifics-air-travel-market-opportunities-and-challenges/ (Accessed: 22 March 2025).
- Journals, I., Rahman, K., Mostari, S. and Azad, S. (2015) ‘A Competitive Analysis of Airline Industry: A Case Study on Biman Bangladesh Airlines’. Available at: https://api.semanticscholar.org/CorpusID:28411672 (Accessed: 18 March 2025).
- Kostiuk, O. and Chikalkin, S. (2024) ‘The role of management consulting in the corporate governance system’, Smart Supply Chain Management, pp. 119–125. Available at: https://doi.org/10.46783/smart-scm/2024-24-12 (Accessed: 18 March 2025).
- Mankhin, B., Khan, M., Begum, M. and Hossain, M. (2023) ‘Market attractiveness of pineapple and banana agroforestry systems of Madhupur Sal (Shorea robusta) forest: A sustainable way of generating income and conserving forests’, Journal of Agriculture and Food Research, 11, p. 100475. Available at: https://doi.org/10.1016/j.jafr.2022.100475 (Accessed: 21 March 2025).
- Mokaya, S.O., Wakhungu, B. and Gikunda, R. (2012) ‘The application of McKinsey Matrix in determination of route attractiveness and resource allocation in Kenya Airways’, International Journal of Humanities and Social Science, 2, pp. 259–268.
- Lin, C. and Hsieh, P.J. (2004) ‘A fuzzy decision support system for strategic portfolio management’, Decision Support Systems, 38(3), pp. 383–398.
- OAG (2024) The world’s most connected low-cost carrier airports: Aviation Market Analysis. OAG. Available at: https://www.oag.com/blog/worlds-most-connected-low-cost-carrier-airports (Accessed: 22 March 2025).
- Quarterly, M. (2008) Enduring ideas: The GE–McKinsey nine-box matrix. McKinsey & Company. Available at: https://www.mckinsey.com/capabilities/strategy-and-corporate-finance/our-insights/enduring-ideas-the-ge-and-mckinsey-nine-box-matrix (Accessed: 20 March 2025).
- Researchnester, info (2025) Low-cost carrier market size & share: Forecast report 2037. Research Nester. Available at: https://www.researchnester.com/reports/low-cost-carrier-market/7209 (Accessed: 22 March 2025).
- TTW (2025) Southeast Asia’s aviation surge how Top Airlines, from Lion Air to Malaysia Airlines, are capitalizing on booming tourism and increasing air travel demand. Travel And Tour World. Available at: https://www.travelandtourworld.com/news/article/southeast-asias-aviation-surge-how-top-airlines-from-lion-air-to-malaysia-airlines-are-capitalizing-on-booming-tourism-and-increasing-air-travel-demand/ (Accessed: 19 March 2025).
- Vukotic, S., Anicic, J. and Vukotic, R. (2017) ‘The importance of consulting in contemporary business management’, Journal of Process Management. New Technologies, 5, pp. 69–78. Available at: https://doi.org/10.5937/jouproman5-14307 (Accessed: 18 March 2025).